BREAKAWAY MOMENTUM 101
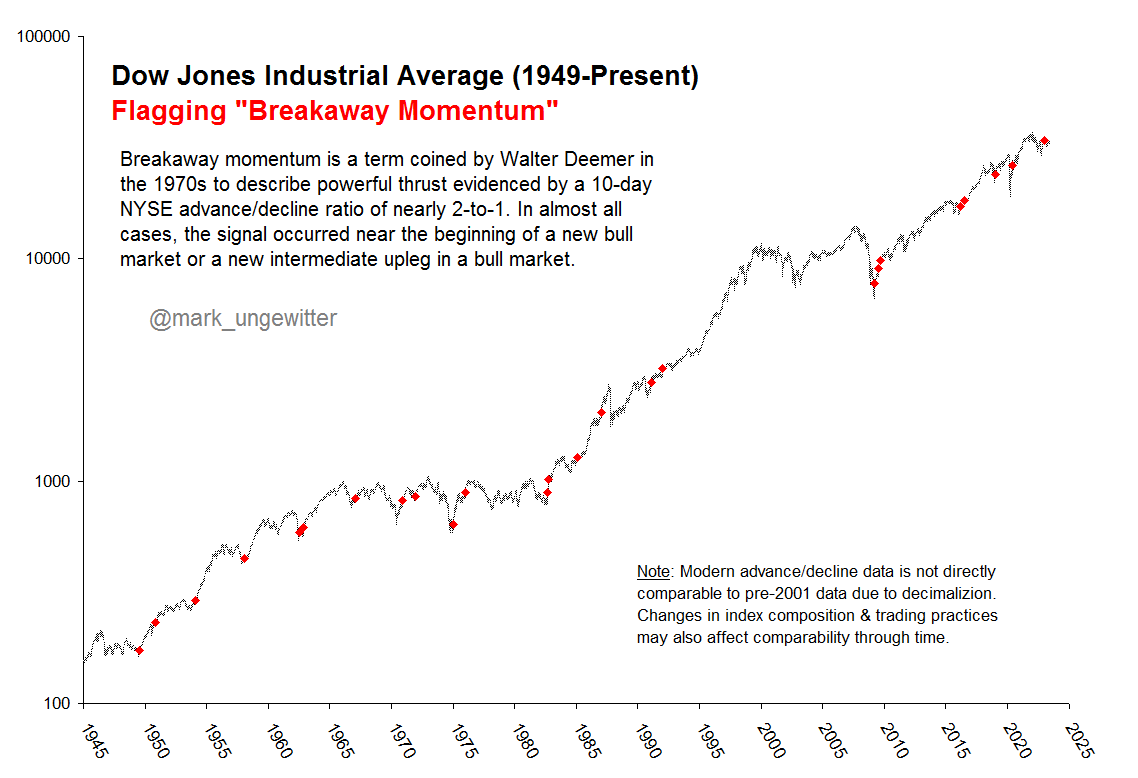
Downside momentum usually peaks at the end of a decline, as prices cascade into a primary low. On the upside, though, momentum peaks at the beginning of an advance, then gradually dissipates as the advance goes on, and the more powerful the momentum at the move's beginning, the stronger the overall move; REALLY strong momentum is found only at the beginning of a REALLY strong move: a new bull market or a new intermediate upleg within a bull market. We coined the term "breakaway momentum" in the 1970's to describe this REALLY powerful upside momentum. The following is a review of what it is and how it is typically generated.
Breakaway momentum (some people call it a "breadth thrust") occurs when ten-day total advances on the NYSE are greater than 1.97 times ten-day total NYSE declines. It is a relatively uncommon phenomenon; the table at the end of this report shows the 25 times it has occurred since World War II (an average of once every 3 1/2 years). Cyclical bull markets, though, are traditionally heralded by breakaway momentum, so we are hopeful that it will be generated this time around, too.
How is breakaway momentum typically achieved? It's not easy. Usually, we need three things to happen. First, we need a VERY strong advance at the outset of the ten-day period. Typically, this requires an advance-decline ratio in the area of 2800-500 on the first day, 2500-700 on Day Two, and 2050-1050 on Days Three and Four. This creates a cumulative ratio of 2.69-1, which is well above the 1.97 threshold. The very strong advances on the first two days followed by still-positive breadth on the next two are a formidable achievement, but the next one is even tougher. Markets never go straight up, and the real trick in achieving breakaway momentum is to keep declines limited during the inevitable corrections that occur in any ten-day period (it takes two advances to offset every decline, which is why "good" breadth days of 2-1, or even 3-1, won't cut it as far as achieving breakaway momentum is concerned). In order to keep declines limited during corrections, the corrections must be minimal; often, this occurs when intraday declines abort before the close, and a big breadth deficit turns into just a narrow one by day's end. Breadth during the "correction days" (Days 5-6), then, should be no worse than 1400-1700; although this pushes the cumulative ratio down to 1.84, this is a far from insurmountable deficit. The final element needed to get breakaway momentum is a second strong advance during Days Seven through Ten; not quite as strong as the initial advance, but not too far behind it, either. If, for example, the market generates breadth during Days Seven through Ten of 2500-700, 2300-800, 2100-1000 and 1900-1200, the ten-day breadth totals are 21000 and 10400. This generates a ten-day breadth ratio of 2.02 - breakaway momentum!
The real trick in generating breakaway momentum? It's not a lot of advances; it's a lack of declines. If the market stages a strong two-day advance, for example, it MUST maintain very positive breadth days for a couple of days afterwards (Days Three-Four and Nine-Ten) to keep the ten-day declines to a minimum. Also, declines MUST be kept to a minimum during the "normal" correction in the middle of the ten-day period; declines can exceed advances during those two days, but not by much or it will be impossible for the market to generate the two advances needed to offset every decline.
TABLE I - BREAKAWAY MOMENTUM SINCE 1945
| SIGNAL |
PEAK |
SIGNAL |
PEAK |
| DATE |
A-D RATIO |
DATE |
A-D RATIO |
|
|
|
|
| Jul 14 1949 |
2.07 |
Jan 23 1985 |
1.972 |
| Nov 20 1950 |
2.01 |
Jan 15 1987 |
2.36 |
| Jan 25 1954 |
2.01 |
Feb 5 1991 |
2.17 |
| Jan 24 1958 |
2.00 |
Jan 6 1992 |
1.974 |
| Jul 11 1962 |
2.37 |
Mar 23 2009 |
2.22 |
| Nov 9 1962 |
2.50 |
Jul 23 2009 |
2.17 |
| Jan 18 1967 |
2.13 |
Sep 16 2009 |
2.12 |
| Dec 4 1970 |
2.12 |
(*)Mar 11 2016 |
1.80 |
| Dec 8 1971 |
1.98 |
Jul 12 2016 |
2.19 |
| Jan 8 1975 |
2.46 |
Jan 9 2019 |
2.18 |
| Jan 6 1976 |
2.53 |
Jun 3 2020 |
2.07 |
| Aug 23 1982 |
2.68 |
Jan 12 2023 |
2.16 |
| Oct 13 1982 |
2.09 |
|
|
|
|
|
|
|
|
|
|
|
|
(*)20-day ratio |
signal |
January 2019 Addendum
The ten-day ratio of advances to declines is used to define Breakaway Momentum. In 2016, however, Mark Ungewitter noted that the 20-day ratio hit an unusually-high 1.80 on March 11 even though the ten-day ratio never exceeded its 1.97 threshold. This was the first time the 20-day ratio had exceeded 1.72 without an accompanying 10-day reading above 1.97.
Given subsequent market action, we now know the 20-day 1.72-plus reading was a "good" signal even though it wasn't confirmed by the ten-day ratio until July 12th. Accordingly, I have added it to the table - but with an asterisk, both to indicate that it is the 20-day ratio and to differentiate it from the 12 other post-1973 signals which were all generated and noted in real time.
So: We now know that the stock market generates breakaway momentum when ten-day total advances on the NYSE are greater than 1.97 times ten-day total NYSE declines OR 20-day total advances on the NYSE are greater than 1.72 times 20-day total NYSE declines. (Just in case the market decides to generate another 20-day signal without an accompanying ten-day signal.)
Post-BAM Performance
Post-BAM declines/corrections tend to be surprisingly brief and shallow given the amplitude of the BAM-genersting advance. (When the train leaves the station it doesn't back up to let late-comers get aboard.)
Via and courtesy of @twillo1:
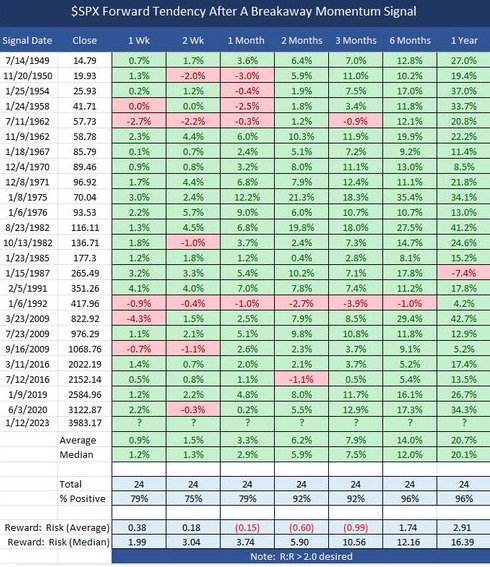
And via and courtesy of Mark Ungewitter:
-- Walter Deemer
(c)2002-2023, DTR Inc. All Rights Reserved